How students rated this courses
5.0
(Based on 1 reviews )
100%
0%
0%
0%
0%
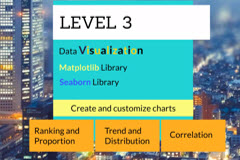
This third course, as part of the Machine Learning series, aims to help you to perform Exploratory Data Analysis (EDA) by visualizing a dataset using a variety of charts. You will learn the fundamentals of data visualization in Python using the well-known Matplotlib and Seaborn data science libraries, and selecting the right chart for the right job. Each section has a summary exercise as well as a complete solution to practice your new skills.
(Based on 1 reviews )